Nextcloud
Install the ScienceMesh app
Go to the Nextcloud server apps/ directory (or some other directory used):
cd apps/
Get the Nextcloud ScienceMesh integration app.
You can download the latest version from the application release page on GitHub. Note that you need at least version 1.1.0 of the application.
wget https://github.com/sciencemesh/nc-sciencemesh/archive/v1.1.0.tar.gz
tar -xzf v1.1.0.tar.gz
mv nc-sciencemesh sciencemesh
chown -R www-data:www-data sciencemesh
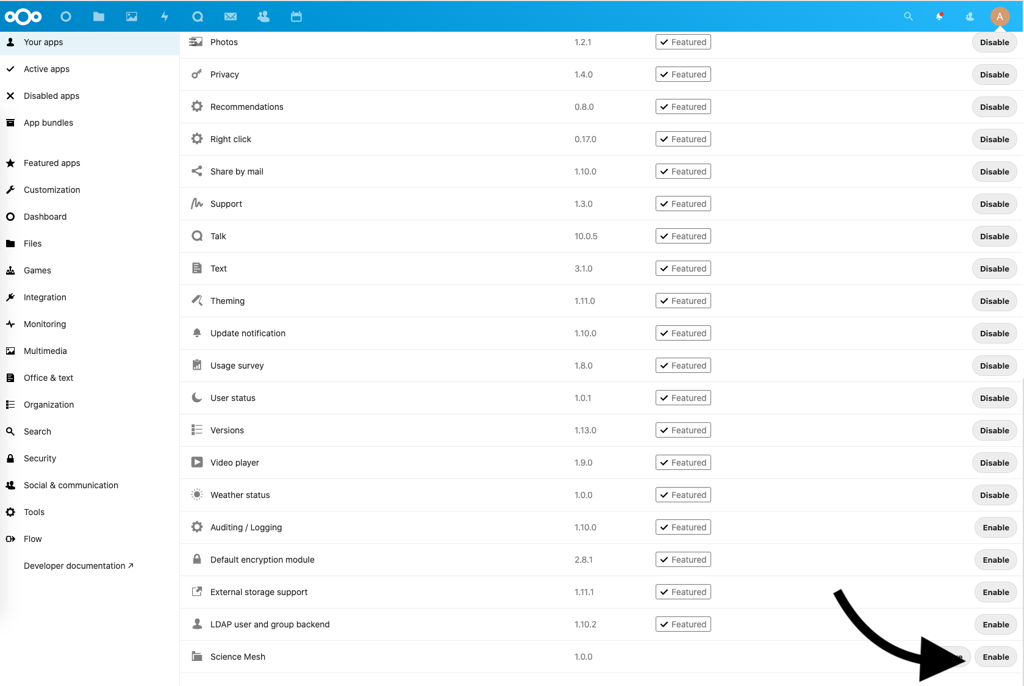
In Nextcloud open the ~/settings/apps/disabled page with Not enabled apps by an administrator and click Enable for the ScienceMesh application.

Nextcloud App settings menu
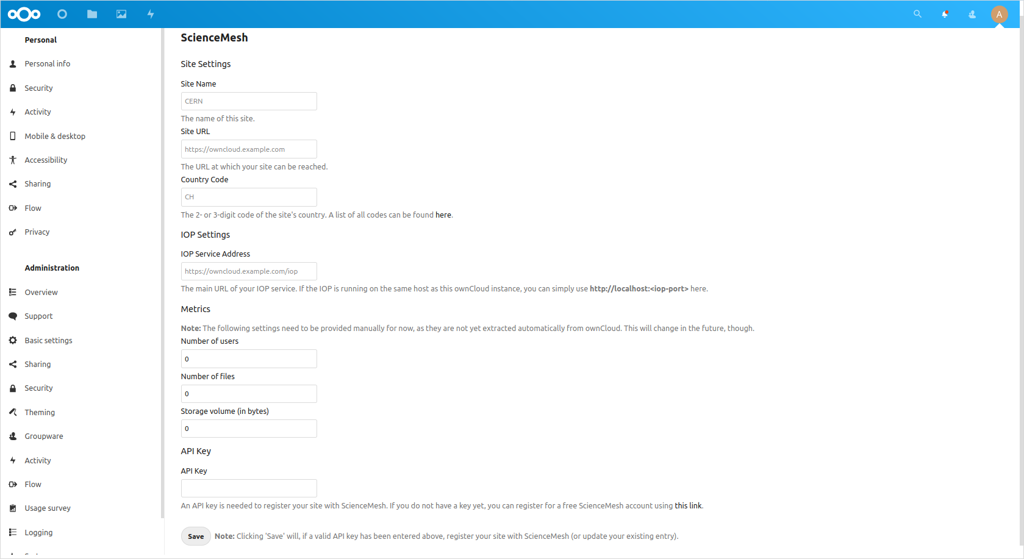
Once the app is enabled, you can go to Settings>Additional Settings and fill the information presented:

ScienceMesh application configuration
To register with the ScienceMesh, you will also need an API key. First, create a free ScienceMesh account using this link. Once your registration has been approved, you will receive your unique API key via email which you can then enter in the application settings.
After fillling the details of your instance, you can check the internal metric endpoint by accessing the following url:
https://<your_instance>/index.php/apps/sciencemesh/internal_metrics

Internal metrics endpoint
Install the IOP
You need to download the latest available version of the revad binary in the Github releases page.
You need to create a configuration file for the IOP: metrics.toml
[http]
address = "0.0.0.0:5550"

[http.services.metrics]
metrics_data_driver_type = "xcloud"
metrics_record_interval = 5000
xcloud_instance="http://localhost"
xcloud_pull_interval=60

[http.services.prometheus]
You need to put the xcloud_instance variable to the url of the Nextcloud instance.
Note: if your IOP is running on localhost, you need to add the following configuraton parameter to your nextcloud instance to allow Nextcloud to create requests to localhost
config.php
'allow_local_remote_servers' => true
Run the IOP with the configuration file:
revad -c metrics.toml
Verify that you are connected to the ScienceMesh
Once the IOP and the ScienceMesh are correctly configured, you can access the following metrics endpoint:
https://<your_instance>/index.php/apps/sciencemesh/metrics

Prometheus endpoint working
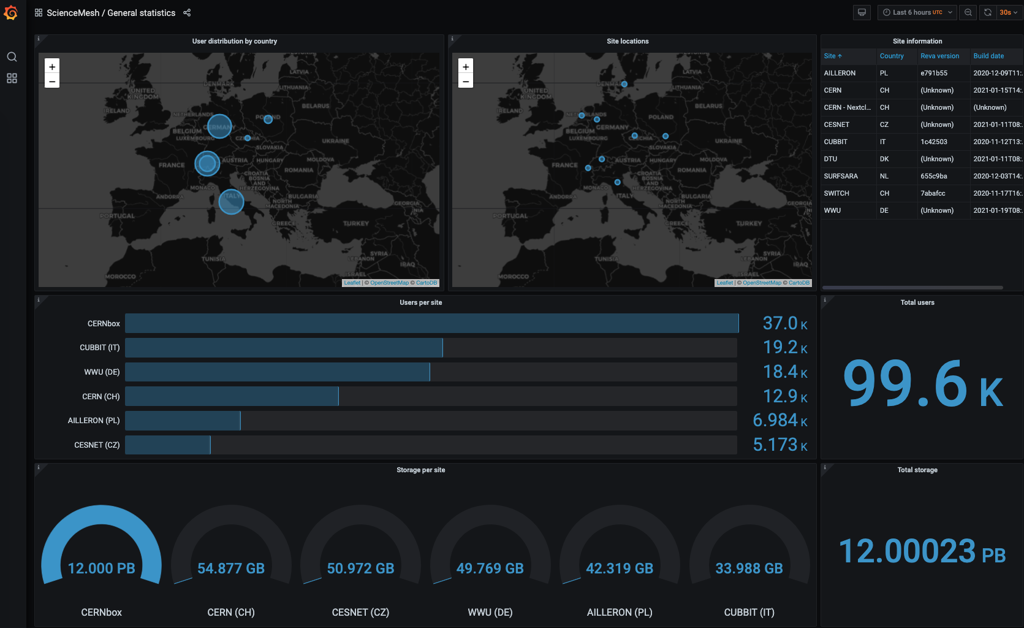
When your site is authorized in the ScienceMesh, it will appear on the ScienceMesh map:

ScienceMesh map