Central Component Implementation
This section describes the Central Component used for managing the central metadata and performing external monitoring in the Science Mesh project. Services of the Central Component are operated by the Science Mesh, and sites run systems that interact with parts of the Central Component, e.g. read mesh metadata out of it and/or write status and metrics of the site.
The Central Component is an implementation of the Central Component described in architecture introduction.
Overview
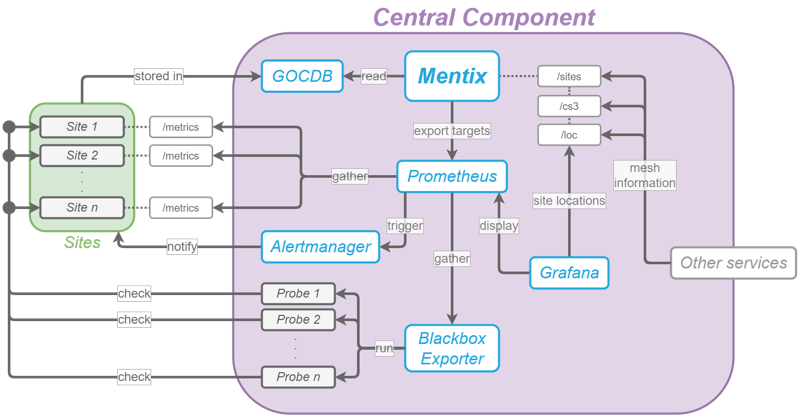
The Central Component (CC) consists of various interconnected services that are responsible for managing the mesh metadata, as well as taking care of health monitoring and alerting. Below image shows a diagram of these services, which will be described in brief in the following sections:
Your IOP instance will be configured to pull Science Mesh metadata from the CC and to push health, status, and usage information into it. Both sides need to be configured to set up their endpoints.
Mentix
To connect the various components of the CC, a service called Mentix (short for Mesh Entity Exchanger) is used. Mentix is responsible for gathering site and service metadata from the GOCDB (see below) and exporting it to other services, both external and internal ones. Mentix can thus be seen as the bridge between the mesh topology information provider and all services that require this information.
GOCDB
The GOCDB forms the central database of the mesh and is used to store all metadata about the various sites participating in the Science Mesh. It is used by several other services, especially within the CC, to gather information about the different entities (sites, services, etc.) in the mesh. In a detailed GOCDB manual, we describe how to obtain GOCDB access and configure metadata for your site. Each site is responsible for keeping its own information stored in the GOCDB up to date.
Prometheus
To gather all metrics and health information about the mesh and its individual sites, a Prometheus instance is used. As can be seen in above diagram, it is automatically configured by Mentix: Whenever the mesh topology has been modified, all targets which are to be monitored are updated as well.
Blackbox Exporter
To perform health checks on the remote sites and collect this information through Prometheus, a service called Blackbox Exporter is used; details about the fork used for the Science Mesh project can be found here. Just like the central Prometheus instance, it is automatically configured by Mentix. The Blackbox Exporter periodically runs various so-called probes for every service which check them for proper functionality and expose the results in a form consumable by Prometheus.
Alertmanager
To inform administrative users about issues that were detected through monitoring, an Alertmanager instance is used. This ensures that administrators can react swiftly to any arising problems.
Grafana
All information collected by Prometheus is presented to the user through various Grafana dashboards.
If unsure where to go next, learn about the Mesh Directory Service.